Deep Dive: explanation, video overview and podcast.
This Greater Baton Rouge real estate report provides a comprehensive look at residential market activity for November 2025. It compares local trends, such as a 1.1% dip in median sales prices and a significant 13.2% rise in days on market, against broader national housing statistics. Key metrics detailed in the document include increased pending sales, a growing inventory of 3,329 units, and a steady 4.4-month supply of available homes. Through historical data and monthly indicators, the source illustrates a shifting landscape where housing affordability has improved slightly despite a cooling in the number of closed sales. Ultimately, these documents serve as a research tool for understanding the economic health and pricing trajectory of the regional property market.
Greater Baton Rouge Real Estate Market Analysis: November 2025
Introduction: A Market in Transition
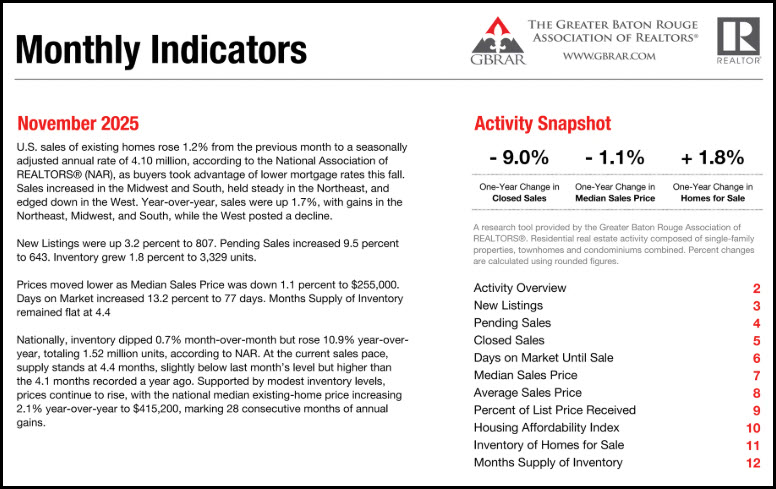
This report provides a comprehensive analysis of the Greater Baton Rouge real estate market for November 2025, based on data from the Greater Baton Rouge Association of REALTORS® (GBRAR) Multiple Listing Service (MLS). The local market is currently navigating a period of transition, characterized by moderating home prices, a slower pace of sales, and conflicting demand signals. The most notable dynamic this month is the sharp contrast between a year-over-year decline in completed transactions and a significant surge in pending sales, suggesting a potential shift in momentum as the year closes. This local trend unfolds within a national context where, according to the National Association of REALTORS® (NAR), U.S. existing home sales rose 1.2% from the previous month.
——————————————————————————–
1. Market Activity: Analyzing the Flow of Transactions
Tracking market activity provides a clear view of the real estate cycle’s current state. Metrics such as New Listings, Pending Sales, and Closed Sales serve as the market’s vital signs, indicating seller confidence, the strength of buyer demand, and the overall velocity of transactions from start to finish.
1.1. New Listings: Seller Confidence Shows Modest Growth
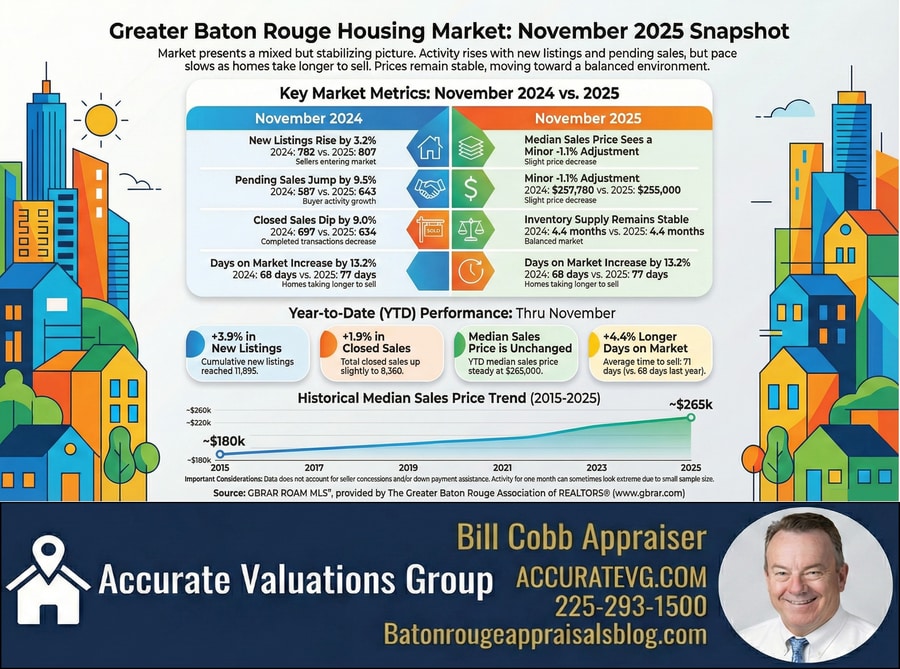
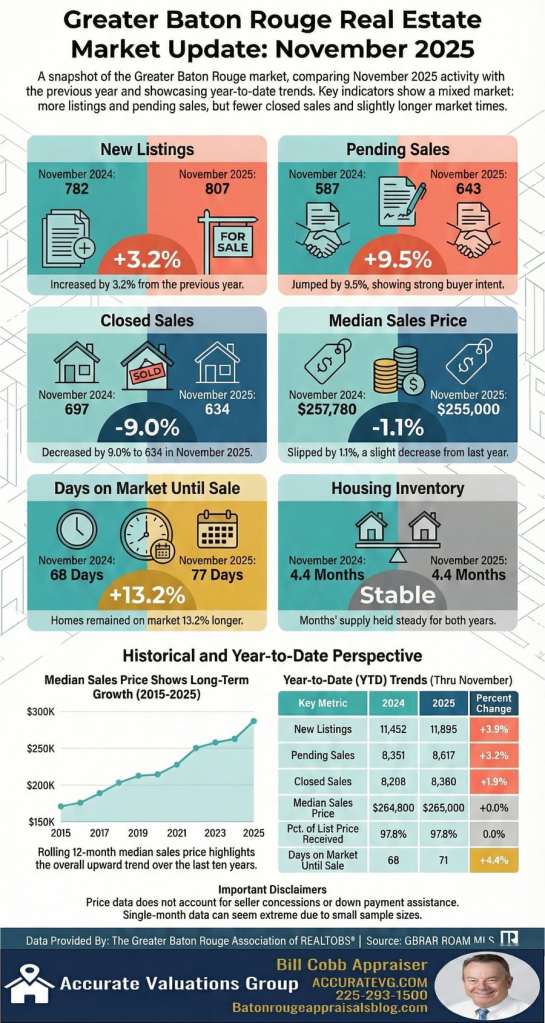
In November 2025, sellers brought 807 new listings to the market, a 3.2% increase compared to November 2024. This modest monthly gain is consistent with the broader annual trend, with Year-to-Date (YTD) new listings reaching 11,895, up 3.9% from the previous year. This steady but controlled increase in new properties for sale is crucial for replenishing the market’s inventory pipeline, providing more options for prospective buyers without overwhelming supply.
1.2. Pending Sales: A Leading Indicator of Future Demand
Pending sales, which represent properties with accepted offers but not yet closed, are a powerful forward-looking indicator of market health. In November, this metric showed remarkable strength, with 643 pending sales—a significant 9.5% increase year-over-year. This monthly surge builds upon positive YTD momentum, which saw 8,617 homes go under contract, a 3.2% rise from the same period in 2024. The strong uptick in pending activity suggests a potential rebound in closed sales in the coming months as these transactions reach completion.
1.3. Closed Sales: A Look at Completed Transactions
In contrast to the optimistic signal from pending sales, the number of completed transactions declined in November. There were 634 closed sales, marking a 9.0% decrease from the previous year. While this monthly figure indicates a slowdown, the year-to-date performance remains slightly positive. A total of 8,360 homes have sold so far in 2025, representing a 1.9% increase over the same period last year. This divergence—stronger contract activity yet fewer completed sales—suggests potential closing delays or a lag effect. Ultimately, the market’s velocity is determined by the prices buyers and sellers can agree upon.
——————————————————————————–
2. Pricing Analysis: A Shift Towards Moderation
Analysis of pricing trends provides the clearest insight into market valuation and the negotiating dynamics between buyers and sellers. This month, key indicators point toward a definitive cooling trend. The Median Sales Price provides a clear view of the market’s central price point, while the Average Sales Price can reflect shifts in the mix of properties sold.
2.1. Median and Average Sales Prices
A direct comparison reveals a softening in home values compared to the previous year.
| Metric | November 2025 Value | Year-Over-Year Change |
| Median Sales Price | $255,000 | -1.1% |
| Average Sales Price | $287,078 | -4.8% |
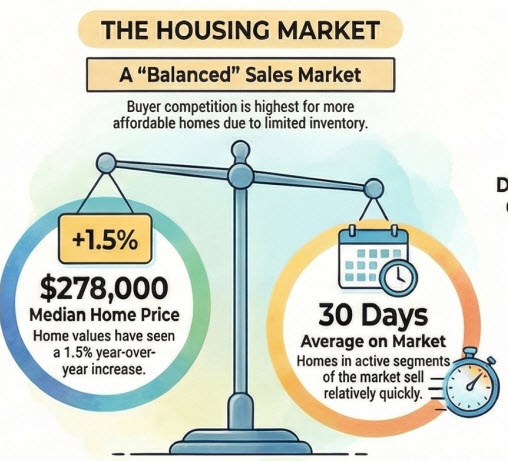
The more pronounced 4.8% decline in the Average Sales Price compared to the 1.1% dip in the Median Sales Price indicates a shift in market composition for November, with a greater share of transactions occurring at lower price points. This local price moderation stands in stark contrast to the national trend, where the median existing-home price continued to climb, rising 2.1% year-over-year according to NAR. The YTD data provides valuable context, showing that the Median Sales Price for the year is flat at $265,000, while the YTD Average Sales Price is up slightly by 1.4% to $306,532. This indicates that the price moderation observed in November is a recent development following a year of general price stability.
2.2. Percent of List Price Received: Gauging Negotiation Power
In November, sellers received an average of 97.4% of their final list price, a marginal decrease of 0.3% from the prior year. This high percentage signifies that homes are still selling close to their asking price. However, the slight dip suggests that buyers are gaining a small amount of negotiating power. The YTD figure remains flat at 97.8%, further underscoring that this shift in the negotiating landscape is a very recent market change. These pricing dynamics are heavily influenced by the balance between supply and the pace at which homes are selling.
——————————————————————————–
3. Inventory & Pace: Measuring Market Balance
The relationship between available inventory and the speed of sales determines whether the market favors buyers or sellers. Higher inventory and a slower sales pace can create a buyer’s market, while low inventory and rapid sales create a seller’s market. Currently, Greater Baton Rouge exhibits signs of a balanced, albeit slowing, environment.
3.1. Inventory Levels
The key inventory metrics for November paint a picture of stability:
- Inventory of Homes for Sale: 3,329 units (+1.8%)
- Months Supply of Inventory: 4.4 months (0.0% change)
Although the absolute number of homes for sale has increased slightly, the Months Supply of Inventory—a measure of how long it would take to sell all available homes at the current sales pace—has remained perfectly stable year-over-year. This indicates that the market is absorbing the modest increase in new listings at a balanced rate. This marginal increase in local supply is significantly more constrained than the national picture, where inventory grew 10.9% over the same period, suggesting a tighter supply dynamic in the Baton Rouge market.
3.2. Days on Market Until Sale
The average time a property spent on the market before an offer was accepted was 77 days in November, a notable 13.2% increase from the same month last year. This slowdown is significant, as it confirms that properties are taking longer to sell. For buyers, this extended timeframe provides more opportunity for due diligence and decision-making. For sellers, it underscores the need to set realistic timeline expectations and price their properties competitively from the outset. The market’s price and pace dynamics ultimately shape the financial accessibility of homeownership for consumers.
——————————————————————————–
4. Housing Affordability: The Buyer’s Perspective
The Housing Affordability Index measures whether a median-income household has the necessary income to qualify for a mortgage on a median-priced home. An index of 115, for example, means the household has 115% of the required income, with higher numbers indicating greater affordability.
4.1. Index Performance
The Housing Affordability Index for the Greater Baton Rouge area stood at 115 in November 2025. This represents a significant 6.5% increase in affordability compared to the previous year. This improvement, driven directly by the moderating Median Sales Price, enhances the purchasing power of prospective buyers and may help stimulate demand heading into the winter months.
——————————————————————————–
5. Conclusion: Key Takeaways for Real Estate Professionals
The November 2025 data reveals a complex market in a state of rebalancing. Professionals should focus on the following key takeaways to navigate the current environment and advise their clients effectively.
- A Market of Contradictions: The most telling sign of the market’s transitional nature is the divergence between sales metrics. While Closed Sales fell 9.0%, Pending Sales surged by 9.5%. This suggests that while recent performance has been sluggish, a pipeline of future closings is building. Professionals should monitor pending sales closely as a leading indicator of a potential market rebound in early 2026.
- Shift in Pace and Pricing: The market has unequivocally shifted to a slower pace. The 13.2% increase in Days on Market, coupled with price moderation, has transferred a degree of leverage to buyers. Professionals must advise sellers to price their properties strategically from the outset and prepare for longer marketing timelines to achieve a successful sale.
- Stable Inventory and Improved Affordability: Despite a slight rise in the number of homes for sale, the Months Supply of Inventory is unchanged at a balanced 4.4 months. Critically, the combination of moderating prices has produced a tangible 6.5% year-over-year improvement in the Housing Affordability Index. This enhanced affordability could serve as a catalyst to stimulate buyer demand and support market activity moving forward.
——————————————————————————–
Appendix: November 2025 Market Metrics At-a-Glance
| Metric | Nov 2025 vs. Nov 2024 |
| New Listings | 807 (+3.2%) |
| Pending Sales | 643 (+9.5%) |
| Closed Sales | 634 (-9.0%) |
| Days on Market Until Sale | 77 (+13.2%) |
| Median Sales Price | $255,000 (-1.1%) |
| Average Sales Price | $287,078 (-4.8%) |
| Percent of List Price Received | 97.4% (-0.3%) |
| Inventory of Homes for Sale | 3,329 (+1.8%) |
| Months Supply of Inventory | 4.4 (0.0%) |
| Housing Affordability Index | 115 (+6.5%) |