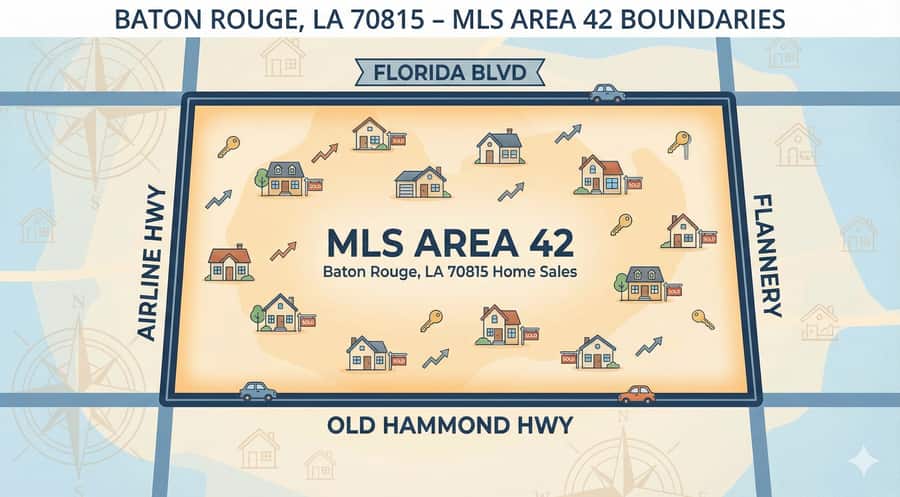
2024 vs 2025 Greater Baton Rouge Home Sales
“Greater Baton Rouge” includes all nine (9) Parishes, some 4 local, 5 outlying. Includes all single-family types from DSF detached, ASF attached (townhomes and condos) and MFM (manufactured).
Greeter Baton Rouge Sales In Baton Rouge Home Appraisal Perspective, sales are DOWN 29% from 2021 to 2022 levels:
2020: 12,753
2021: 14,086
2022: 11,785
2023: 8,718
2024: 8,970
2025: 9,144
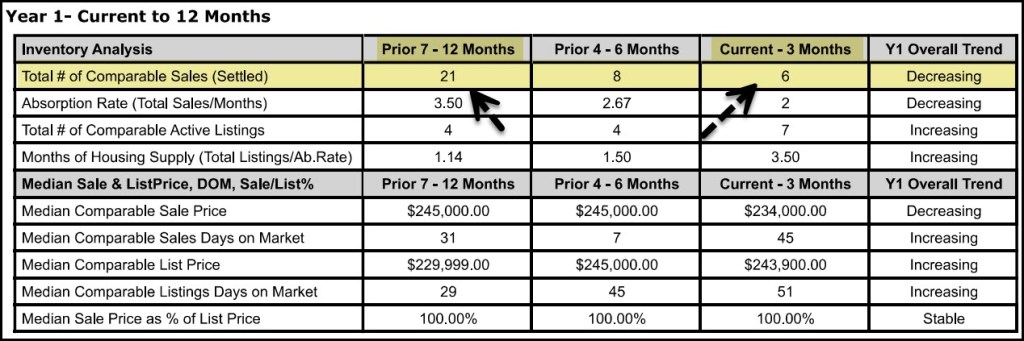
And, in the last 4-months of 2025, they are down drastically based on what I see from comparisons. Here’s two examples:
First example shows sales DECLINING from 21 vs 6 or down 71%. I see this type of tend quite often. The number of sales needed to accurately estimate value, as well as support adjustments for pools, extras, remodeling, etc. is diminishing.
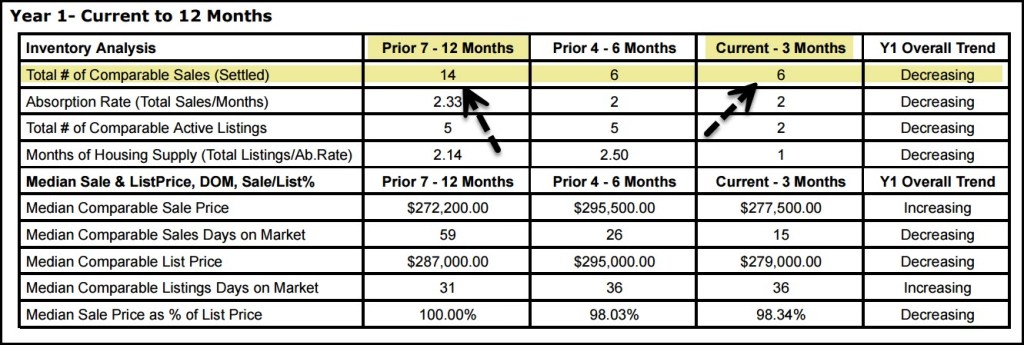
Second example shows sales DECLINING from 14 vs 6 or down 57%.
This still is the result of high mortgage rates and most importantly, HIGH HOMEOWNER’S INSURANCE RESETS (ever increasing). Local Assessor’s reassessing resulting in higher property taxes is also a culprit. If you include inflation for everything, THERE IS A SQUEEZE AROUND THE NECKS OF LOCAL HOMEOWNERS straining them so tightly, to where some are losing their homes. When they purchased their homes, they could afford them. It’s not because they were irresponsible with their finances. The rising cost of everything is a fact not all are keeping up with and more Baton Rougeons will lose their homes in 2026.
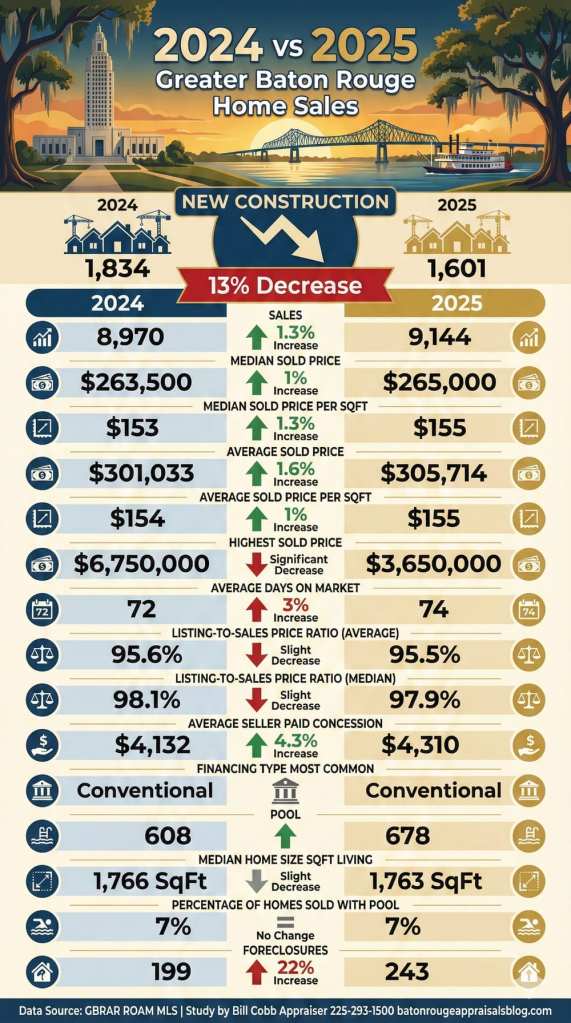
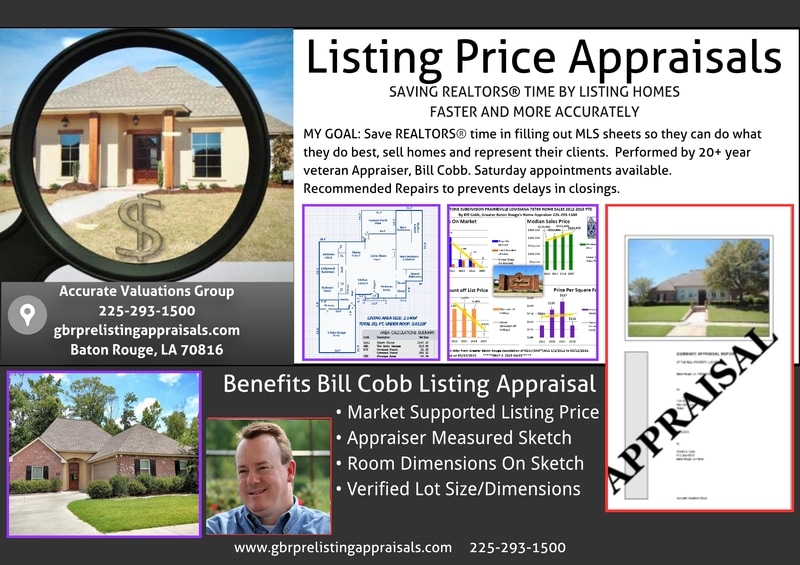
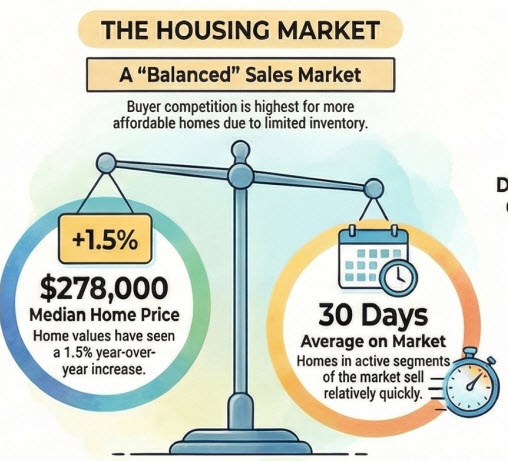
Sales: 8,970 2024 vs 9,144 2025, 1.3% Increase
Median Sold Price: $263,500 2024 vs $265,000 2025, 1% Increase
Median Sold Price Per SqFt: $153 2024 vs $155 2025, 1.3% Increase
Average Sold Price: $301,033 2024 vs $305,714, 1.6% Increase
Average Sold Price Per SqFt: $154 2024 vs $155 2025, 1% Increase
Highest Sold Price: $6,750,000 2024 vs $3,650,000 2025
Average Days On Market: 72 2024 vs 74 2025, 3% Increase
Listing-To-Sales Price Ratio (Average): 95.6% 2024 vs 95.5% 2025
Listing-To-Sales Price Ratio (Median): 98.1% 2024 vs 97.9% 2025
Average Seller Paid Concession: $4,132 2024 vs $4,310 2025, 4.3% Increase
Financing Type Most Common: Conventional
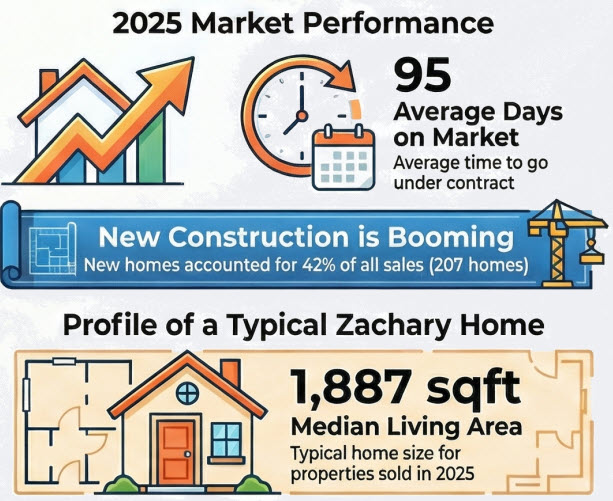
New Construction: 1,834 2024 vs 1,601 2025, 13% Decrease
Pool: 608 2024 vs 678 2025
Median Home Size SqFt Living: 1,766 SqFt vs 1,763 SqFt
Percentage of Homes Sold With Pool: 7% 2024 vs 7% 2025
Foreclosures: 199 2024 vs 243 2025, 22% Increase
NOTE: Foreclosures still only make up 3% of sales in MLS. However, most foreclosure aren’t even published or listed in MLS any longer. Most are Sheriff Sales at the courthouse, not listed with a REALTOR. So, the actual numbers are higher. By how much? The numbers are not published to know.
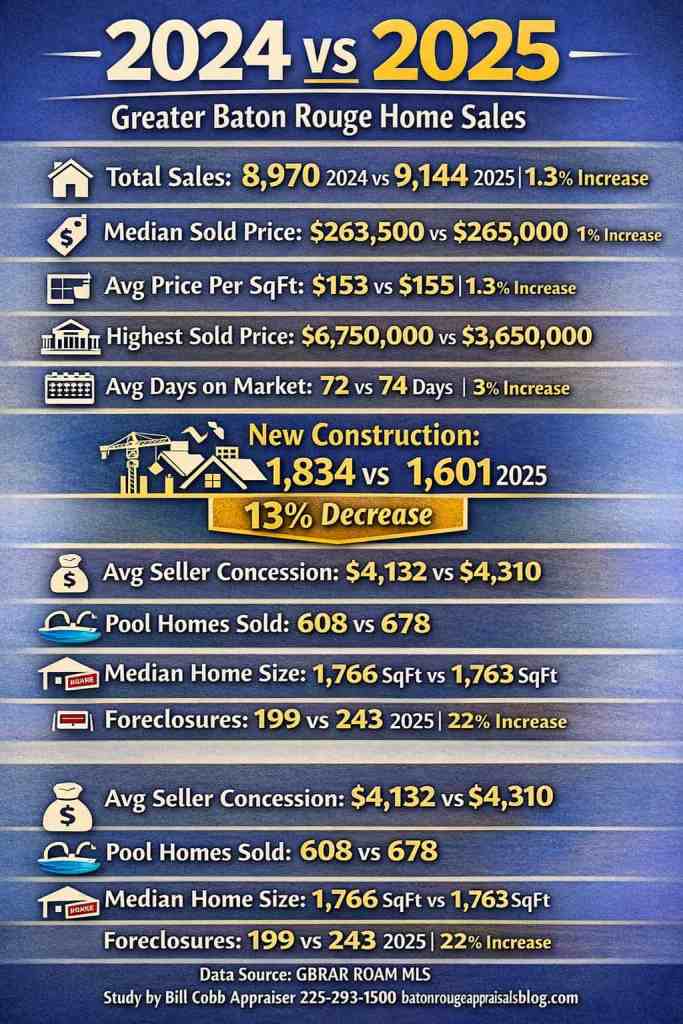
Data Source: GBRAR ROAM MLS | Study by Bill Cobb Appraiser 225-293-1500 batonrougeappraisers.com
1/1/2024 to 12/31/2025 extracted 1/17/2026.