The Bottom Line: 70817 Is a Balanced Market
Based on 464 closed sales of detached single-family homes in ZIP 70817 over the 12 months ending May 26, 2026, the Baton Rouge 70817 market is BALANCED — flat pricing, marketing times up year-over-year, and persistent seller concessions. It is neither a buyer’s market nor a seller’s market. Prices are holding, homes are taking longer to sell than they did in 2024, and sellers are routinely contributing to buyer closing costs to get deals done.
- Median sale price: $301,000 (down 1.3% from $305,000 the prior 12 months) — flat, not declining.
- Median price per square foot: $161.87 vs. $161.44 prior (up 0.3%) — essentially unchanged.
- Months of supply: 3.65 (141 active listings against 38.7 sales per month) — squarely in the balanced 3-to-6-month range.
- Median sale-to-list ratio: 99.12%; sale-to-original-list ratio 97.85% — clearing close to asking.
- Median days on market: expanded from 17 days to 36 days year-over-year.
- Seller concessions: present in 61.6% of sales at a median of $6,900 (2.38% of sale price).
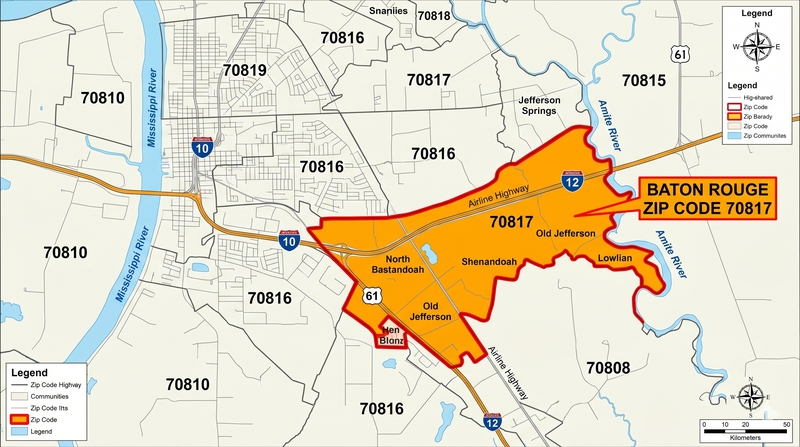
[IMAGE 2 — Insert 70817_map.jpg here. Caption: Baton Rouge ZIP Code 70817 boundary — including Shenandoah, Old Jefferson, and North Bastandoah.]
Trailing 12-Month Summary
| Metric | Prior 12 Mo | Last 12 Mo | Change | Direction |
|---|---|---|---|---|
| Closed Sales | 210 | 464 | +121.0%* | Increasing |
| Median Sale Price | $305,000 | $301,000 | -1.3% | Stable / Flat |
| Median $/SqFt | $161.44 | $161.87 | +0.3% | Stable |
| Median DOM | 17 | 36 | +19 days | Expanding |
| Median SP/LP Ratio | 100.00% | 99.12% | -0.88 pts | Softening |
| Median SP/OP Ratio | 98.60% | 97.85% | -0.75 pts | Softening |
| Concession Prevalence | 60.5% | 61.6% | +1.1 pts | Elevated / Stable |
| Median Concession ($) | $7,000 | $6,900 | -$100 | Stable |
| Active Inventory | — | 141 | — | Balanced |
| Months of Supply | — | 3.65 | — | Balanced |
*Volume comparison overstated. Prior 12-month data within this extract begins September 2024; a full apples-to-apples annual comparison is not possible. Direction shown for transparency.
Quarterly Trend
| Quarter | N | Median SP | Median PPSF | Median DOM | Concession % |
|---|---|---|---|---|---|
| Q2 2025 (partial) | 66 | $297,500 | $161.62 | 18 | 68.2% |
| Q3 2025 | 116 | $299,500 | $163.54 | 31 | 63.8% |
| Q4 2025 | 103 | $300,000 | $160.80 | 36 | 58.3% |
| Q1 2026 | 103 | $300,000 | $159.24 | 61 | 56.3% |
| Q2 2026 (partial) | 76 | $324,950 | $165.03 | 29 | 64.5% |
Median sale price held flat between roughly $297,500 and $300,000 from the second quarter of 2025 through the first quarter of 2026. The partial second-quarter 2026 reading of $324,950 reflects normal spring seasonal mix — more new construction and higher-tier closings — rather than genuine appreciation. Median days on market climbed steadily from 18 days to a peak of 61 days in the first quarter of 2026, then compressed to 29 days in the partial second quarter as spring demand returned. Notably, concession prevalence rose from 56.3% to 64.5% over that same spring window, with the median concession amount climbing from $6,204 to $7,661. Sellers are recovering speed and headline price by giving more back at the closing table, not through true market firming.
Price-Tier Stress and Listing Failures
| Price Tier | Sold (12 Mo) | % of Sales | Active | Listing Failure Rate |
|---|---|---|---|---|
| Under $200K | 28 | 6.0% | 5 | 9.7% |
| $200K – $299K | 195 | 42.0% | 32 | 10.6% |
| $300K – $399K | 109 | 23.5% | 46 | 20.4% |
| $400K – $499K | 51 | 11.0% | 21 | 32.9% |
| $500K – $749K | 60 | 12.9% | 19 | 14.3% |
| $750K and Over | 21 | 4.5% | 18 | 25.0% |
Overpricing stress concentrates in the $400K–$499K tier (32.9% failure rate) and the $750K-and-over tier (25.0%). The dominant $200K–$299K tier — 42% of all sales — carries the lowest failure rate at 10.6%, confirming sustained absorption at price points supported by FHA, VA, and Rural Development financing. Failed listings carried a median asking PPSF of $165.59 against a sold median of $161.87, a 2.3% premium the market did not validate. Median days on market at expiration or cancellation was 106 days. Listings priced 2% to 4% above absorbed market PPSF — particularly above $400,000 — face elevated failure risk.
Supply, Financing, and New Construction
Inventory and absorption: 141 active listings against trailing 12-month absorption of 38.7 sales per month yields 3.65 months of supply. Trailing three-month absorption of 39.7 sales per month (3.55 months) shows no material inventory build. Pending sales total 76.
Financing mix: Conventional financing dominated at 60.8% of sales (282 of 464), followed by FHA at 15.1% (70), cash at 14.4% (67), VA at 4.7% (22), and USDA/Rural Development at 3.0% (14). FHA share rose to 19.4% in the first quarter of 2026, reflecting affordability constraints in the dominant $200K–$299K tier.
New construction: Approximately 114 of 464 trailing sales (24.6%) involved new construction or identified builders, at a median sale price of $448,628 and median PPSF of $186.28 versus a resale median PPSF of $156.16 — a 19.3% per-square-foot premium. Most active builders: Alvarez Construction (30 sales), D.R. Horton (16), Level Construction (13), and DSLD (10). New construction median days on market of 44 exceeds the resale median of 34, consistent with longer build-and-sell timelines rather than market weakness.
Most active subdivisions: Shenandoah Estates (60 sales), Old Jefferson (28), Oak Colony (22), Azalea Lakes (20), Bellacosa (14), The Lake at White Oak (14), Materra (13), Long Farm (12), Woodlawn Estates (11), and Vignes Lake (11).
What This Means for Appraisal Work
Time adjustment: No upward or downward time adjustment is supported on a per-square-foot basis. Median PPSF moved from $161.44 to $161.87 (+0.26%) over the period; the quarterly PPSF range of $159.24 to $166.13 reflects mix variation, not a directional trend. A 0% time adjustment is supported for comparable sales closed within the trailing 12 months.
Concession adjustments: With 61.6% of sales reflecting seller concessions at a median of $6,900, comparable-by-comparable concession adjustments are appropriate per the Fannie Mae Selling Guide. Cash-equivalency analysis should account for the 2.38% median concession typical in this market.
Market conditions disclosure: This market is properly disclosed as stable in price with measurably expanded marketing times, elevated and persistent seller-paid concessions, and balanced supply. It is in equilibrium — not declining and not appreciating.
Additional Findings
Days-on-market distribution: 36.6% of closings (170 sales) closed within 15 days, while 28.9% (134 sales) required more than 90 days. This bifurcation — fast-moving well-priced listings alongside a meaningful tail of extended-marketing-time listings — is characteristic of a balanced market with selective buyer behavior.
Price reductions: 39.7% of closed listings (184 of 464) required at least one list-price reduction before contract. The median reduction was $13,000, or 3.64% off original list.
Active listing aging: Current active inventory shows a median 62 days on market and a median asking PPSF of $176.32 — an 8.9% premium over trailing sold PPSF. Active median year built of 2016 versus a trailing sold median of 1997 indicates active inventory skews newer; even accounting for age, the premium reflects pricing optimism the market will require time or concessions to absorb.
Sale-type integrity: Of 464 trailing sales, 318 (68.5%) were marketed “As Is.” Foreclosure and short-sale activity was minimal (under 1%). The market shows no concentration of distressed sales that would compromise reliance on these data for comparable-sale support.
Data Source: GBRAR ROAM MLS, extracted May 26, 2026. Property Type: Detached Single-Family. Geographic Filter: 70817. Sample: 464 closed sales, 141 active, 76 pending, 96 expired/canceled within the trailing 12-month window. Statistics computed by Accurate Valuations Group. This analysis is prepared in accordance with USPAP, the Fannie Mae Selling Guide, and Fannie Mae Form 1004MC market conditions analysis principles. It is the basis for the market conditions disclosure within an associated appraisal report and is not a standalone appraisal of any property.
Housing Profile by Bill Cobb Appraiser — Accurate Valuations Group, LLC — 225-293-1500 — batonrougeappraisalsblog.com